Structure of present data retrieval system
During the present state of GAW DAQUAS the
system for retrieval of data and system control consists of the following
operating components:
Graphical front end, written completely in Java for user control of
all activities and performances of the whole system:
This front end collects all user relevant
output from the control program and all other user relevant input to the other
part of the station data quality system as there are: Station Book, Backup System, Eval: Isave Program for data evaluation
and quality control, Report Generator and Help functions. In normal
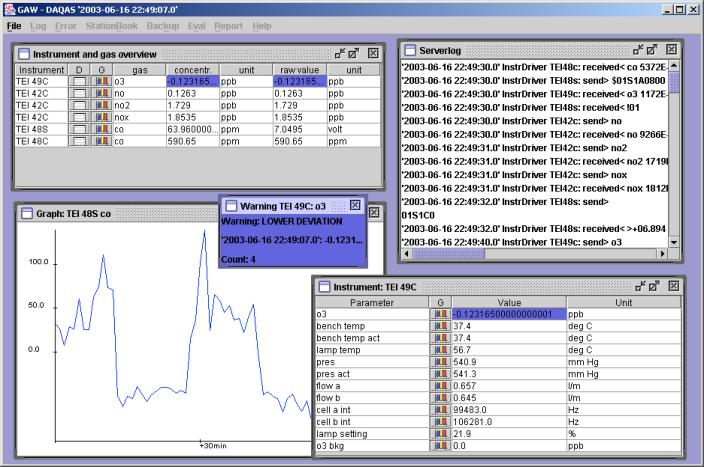
operation mode during operational real time measurement the first Window upper
left is the main control panel which always is opened. It shows all active
measurement devices, the measured gases, their one minute average values of
automatically calculated concentrations and their raw values and the
measurement units. In case the user wants to see a graphical display of measured
time series and occasionally a list of all measurement parameters which have
been measured at the same time an additional list with all measurement
parameters can be opened; -- see table at lower right In case some underflow of
values happens some small signalling window opens with a short memo.
Additionally al list of protocols of interactions of the system can be
displayed and controlled by the user (right side up).
Control Program for
data retrieval, instrument control and online quality assurance support. This
java program controls the ADAM process computer system for analog retrieval of
data and control of automated calibration and zero air control via relays and
magnetic valves. It performs digital data retrieval presently from all Thermo
Environmental system instruments. It also is responsible for database input and
online quality control procedures as over- and underflow control of measured
values and instrument parameters, automatic calibration calculation and control
cards for example. These concentration levels are determined for operational
purposes in order to enable the measurement crew to right in time corrections
of measurements under operation.
Furthermore this database and measurement control program contains methods for
automated quality assurance as control cards and signalling override or
underflow of threshold values.
Database for RAW data on order to contain raw data and related instrument parameters as also
automatic calibration results in order to give the measurement staff in advance
control possibilities about actually measured concentration levels. The
database was realised in the SAP-DB database system which is available for free
via internet.
Database for Meta data, also called station book or log book for input of all practical
activities at the measurement station which can affect measurements and data
quality. A prototype of this database
originally was designed with ACCESS. Now this database also is going to be
realized with SAP-DB system. Each note in this station book consists of a date
and time for start and a duration and an index
for measurement instrument and measured effect.
In order to receive more information please
read the file about user requirements in the following link.:
